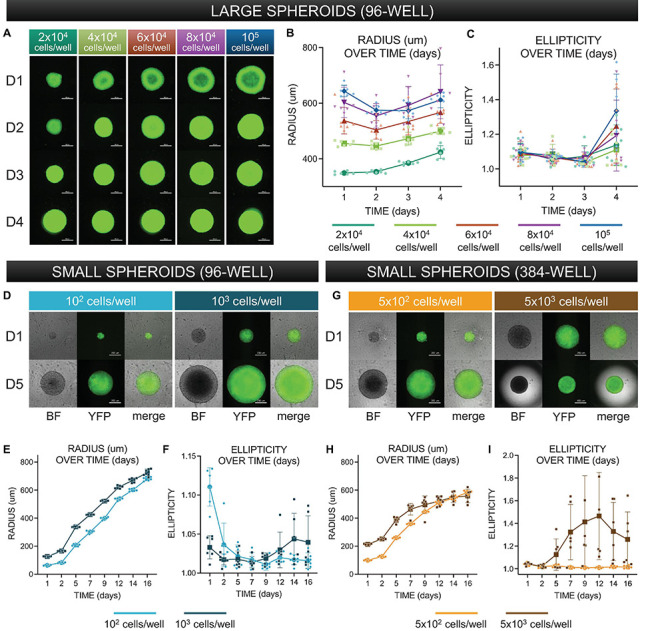
FIGURE 3.

Morphological characterization of three-dimensional spheroids as function of cell density. (A) Assembled “large” spheroid constructs initially seeded at (G1) 2 × 10⁴ cells/well, (G2) 4 × 10⁴ cells/well, (G3) 6 × 10⁴ cells/well, (G4) 8 × 10⁴ cells/well, and (G5) 10 × 104 cells/well. Both brightfield images and fluorescence images (to confirm expression of ChR2-eYFP) were taken every 24 h over 4 days. Scale bar is 0.5 mm. (B) Standard imaging tools were used to contour a five-point ellipse to the outline of the imaged spheroid. Axes were then used to calculate average radius and ellipticity for each spheroid over 4 days. (C) Radius [(major axis + minor axis)/2] as a function of time. (D) Shape (major axis/minor axis) as a function of time. For (C–D), the sample size is 30 spheroids, n = 6 per density and per time point. (D) Assembled “small” spheroids with initial seeding of 102 and 103 cells per well in a 96-well format – brightfield and eYFP fluorescence images shown at days 1 and 5. Scale bar is 0.2 mm. (E,F) Radius and ellipticity over 16 days. The sample size was 12 spheroids, n = 6 per density and per time point. (G) Assembled “small” spheroids with initial seeding of 5 × 10² and 5 × 10³ cells per well in a 384-well format – brightfield and eYFP fluorescence images shown at days 1 and 5. (H,I) Radius and ellipticity over 16 days. The sample size was 12 spheroids, n = 6 per density and per time point. Scale bar is 0.2 mm for day 1 and 0.5 for day 5. In panels (B,C,E,F,H,I), all data points are overlaid in addition to the mean and standard deviation. See Supplementary Figures 1–4 as a function of time. For for complete large spheroid, 96-well format dataset. See Supplementary Figure 7 for complete small spheroid, 96-well and 384-well format datasets. Please see text and Supplementary Figure 8 for details on statistics.
