FIGURE 5.

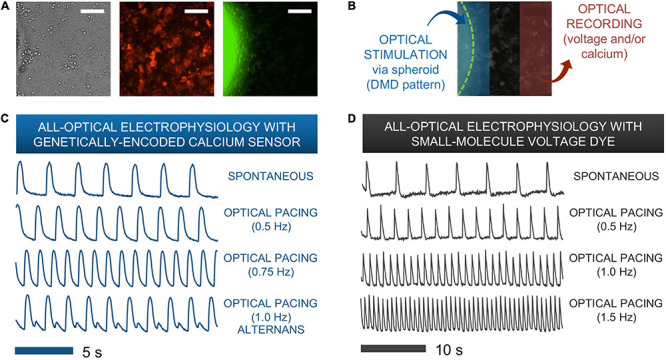
Functional responses from human iPSC-CMs upon spark-cell cluster pacing obtained by all-optical electrophysiology. (A) A typical field-of-view for microscopic optical stimulation experiments featuring brightfield and corresponding fluorescence images. The middle image was produced using a mCherry filter and demonstrates expression of optogenetic sensor for calcium (R-GECO) in the iPSC-CM monolayer. The rightmost image was produced with a YFP filter and shows a portion of the ChR2-eYFP spheroid. Scale bar is 0.1 mm. (B) For recordings, the field-of-view was separated into two non-overlapping areas – patterned optical stimulation including the spheroid and optical recording including only iPSC-CMs labeled with voltage or calcium indicators. (C) Calcium transients from R-GECO-expressing iPSC-CMs showing spontaneous activity and optical pacing (via the spheroid) at three different frequencies after 7 h of spheroid introduction. While a 1:1 stimulation-to-response is observed for optical pacing at 0.5 and 0.75 Hz, overdrive pacing at 1.0 Hz results in failure of iPS-CMs to fully restore calcium stores between stimulation events, hence calcium alternans are seen. (D) Optical pacing can also be confirmed via spectrally compatible small-molecule voltage dye. This sample shows a 1:1 relationship between stimulation and response for pacing frequencies up to 1.5 Hz after 12 h of spheroid integration.
