FIGURE 6.

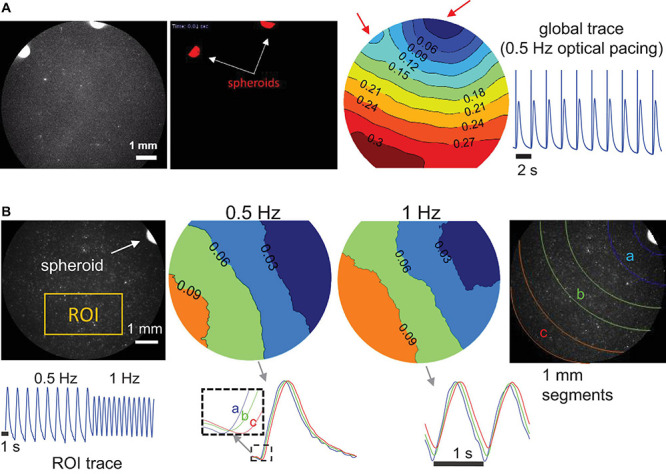
Macroscopic optical mapping of optically triggered spheroid-mediated calcium waves in human iPS-CMs. (A) Calcium waves (by Rhod-4) triggered by optical light pulses at 0.5 Hz through a pair of spheroids after 24 h integration. Activation map shows the origin of early activation (blue), red arrows indicate the locally triggered activity by the two spheroids; isochrones are 0.03 s apart. Global calcium transients and the superimposed optical pulses are shown on the right. (B) Calcium waves by optogenetic sensor R-GECO, triggered at 0.5 and at 1 Hz through a single spheroid (after 24 h integration). In the activation maps (isochrones 0.03 s apart) slight wave-slowing is visible at the higher pacing frequency. At the bottom, an ROI trace is shown for the uninterrupted pacing and traces from different segments away from the spheroid illustrate sequential activation (a, b, and c). Scale bar is 1 mm.
