FIGURE 7.

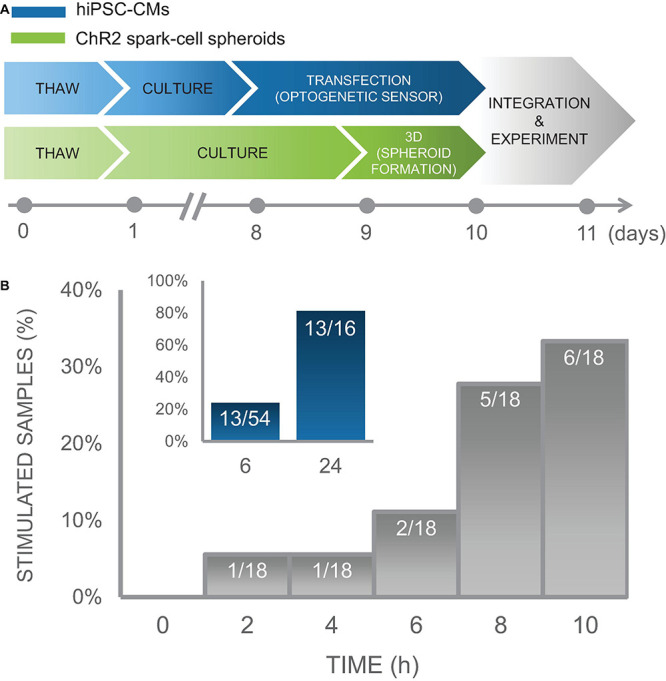
Time course of integration of spark-cell clusters with human iPS-CM monolayers for pacing capture. (A) Experimental preparation timeline including separate treatment of cell lines (hiPSC-CM in blue and ChR2 293Ts in green) before acute functional studies. (B) For an early integration study, 18 samples were tested and the percentage of those samples from which we observed full pacing capture was plotted every 2 h. We observed an increase in the number of optical pacing responders over 10 h. The inset (blue), represents the combined results over multiple cell cultures, summarized as a percent of samples that responded to optical pacing at 6 h (n = 54) and at 24 (n = 16) after spheroids were seeded onto hiPSC-CM syncytia.
