FIGURE 8.

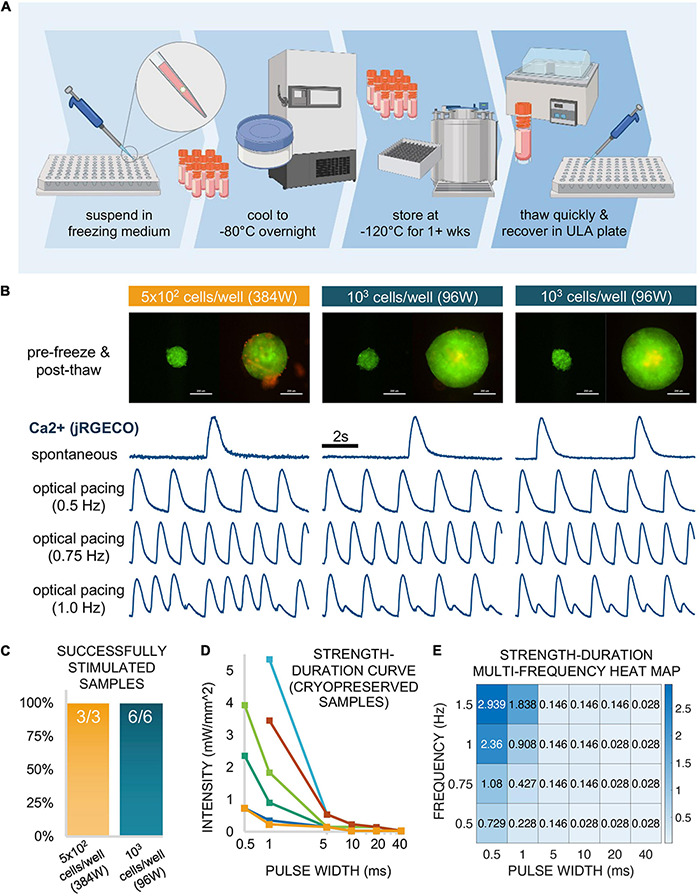
Functional responses via cryopreserved spark-cell clusters. (A) Schematic representation of the spheroid cryopreservation process, both freezing and thawing. (B) Sample spheroids (1 sample seeded in a 384-well spheroid plate at 5 × 10² cells/well and 2 samples seeded in a 96-well spheroid plate at 103 cells/well) from which functional data was obtained. Images (ChR2-eYFP and PI) represent spheroids 1 day before freezing and 6 days after thawing (or 1 day before functional measurements were performed). Scale bar is 0.2 mm. For each depicted spheroid are the corresponding calcium traces from jRGECO-expressing iPSC-CMs show spontaneous activity and responses to optical pacing by a spheroid at three frequencies 18 h after spheroids were applied. Stimulation at 0.5 and 0.75 Hz resulted in a 1:1 response ratio while varying patterns alternans were observed for these samples at 1.0 Hz. (C) Of the thawed spheroids that were introduced to iPSC-CMs, all (100%) of the samples demonstrated optical pacing. (D) A strength-duration (blue light intensity, pulse width) curve was constructed for 6/9 of the responsive cryopreserved samples at six discrete pulse widths: 40, 20, 10, 5, 1, and 0.5 ms. (E) For one of these six samples, a strength-duration heat map was constructed at multiple frequencies (0.5, 0.75, 1.0, and 1.5 Hz) where blue light intensity threshold (mW/mm2) for stimulation increases as pulse width decreases and/or frequency increases. Panel (A) was created using Biorender.
