FIGURE 2.

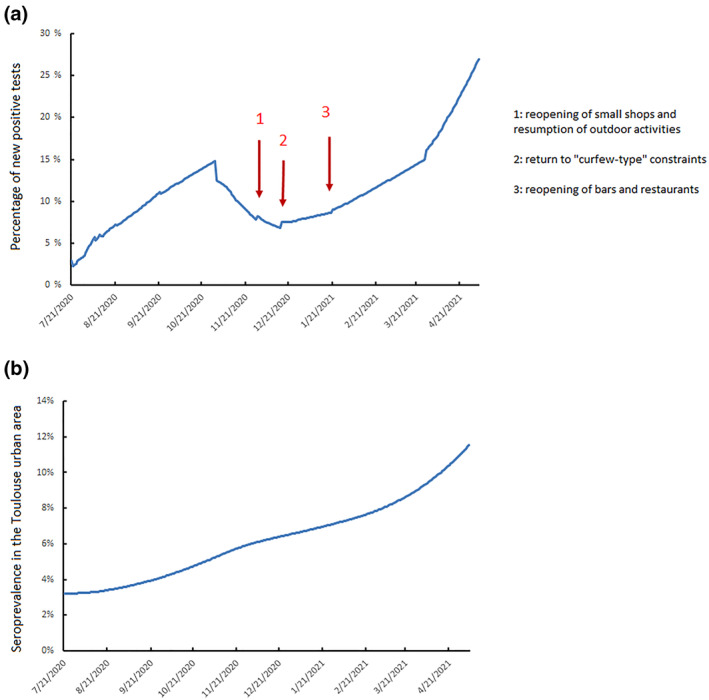
(a) Daily spread of SARS‐CoV‐2 infection, 21 July 2020 to 5 May 2021 depending on the containment strategy. (b) Cumulative SARS‐CoV‐2 seroprevalence in the Toulouse urban area from 21 July 2020 to 5 May 2021

(a) Daily spread of SARS‐CoV‐2 infection, 21 July 2020 to 5 May 2021 depending on the containment strategy. (b) Cumulative SARS‐CoV‐2 seroprevalence in the Toulouse urban area from 21 July 2020 to 5 May 2021