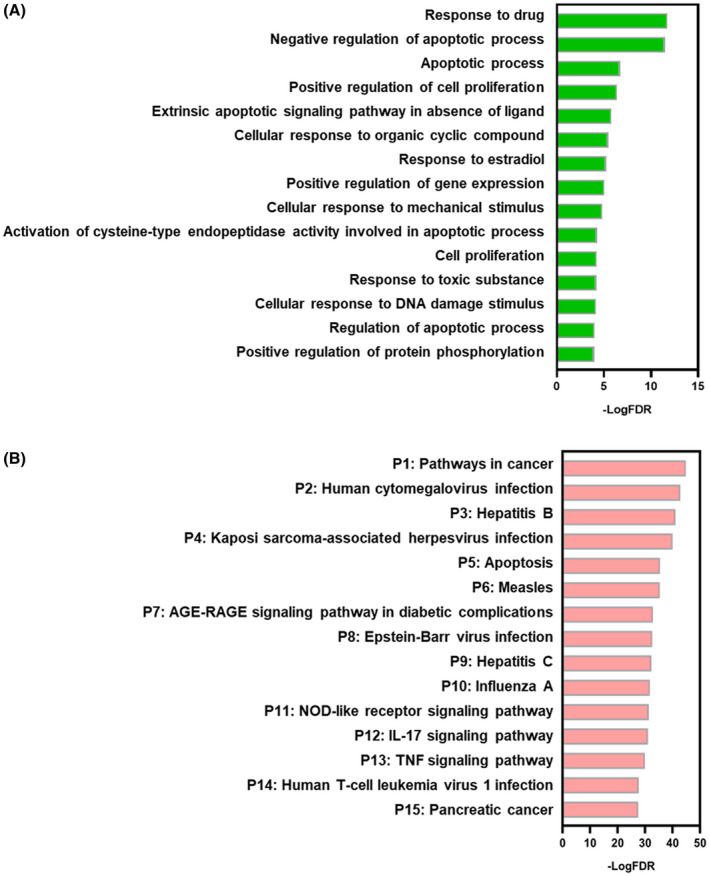
FIGURE 3.

Gene ontology (GO) biological process (BP) analyses and pathway analyses of the targets. A, GO BP analyses; B, Pathway analysis; Y‐axis: top 15 biological processes (A) and top 15 pathway (B) relevant to the enriched targets; X‐axis: significance of each term ranked with –log (false discovery rate) (FDR)
