FIGURE 5.

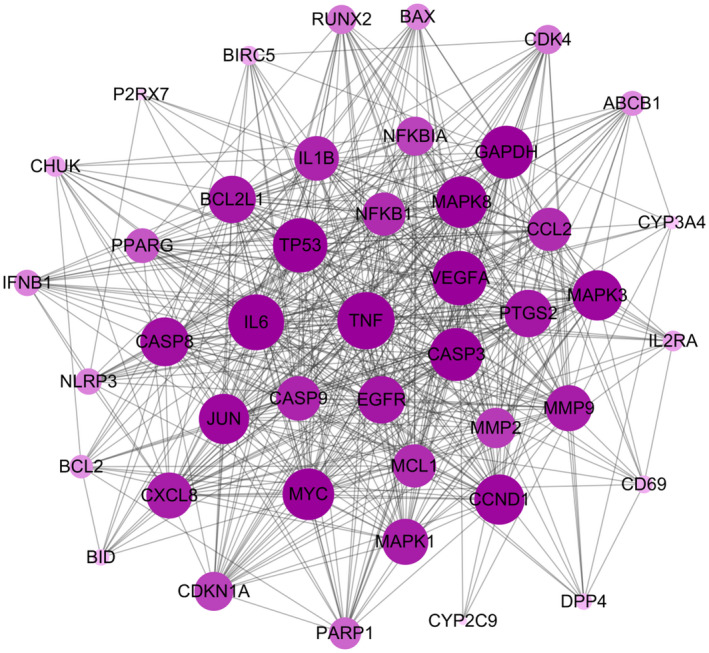
Protein‐protein interactions. Circles represent the targets. Black lines represent the interaction between nodes. Node size is proportional to its degree in network

Protein‐protein interactions. Circles represent the targets. Black lines represent the interaction between nodes. Node size is proportional to its degree in network