
FIGURE 8.
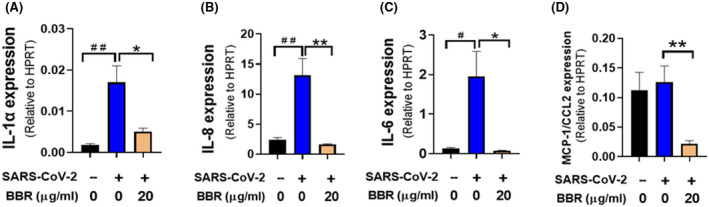
Effect of BBR (berberine/NIT‐X) cytokine expression in infected Calu‐3 cells. Calu‐3 cells were cultured, treated, infected and qPCR were performed. *P < .05,**P < .01 versus infected, but not treated. Data represent two sets of qPCR with six readouts. # P < .05 versus uninfected/untreated