FIGURE 2.

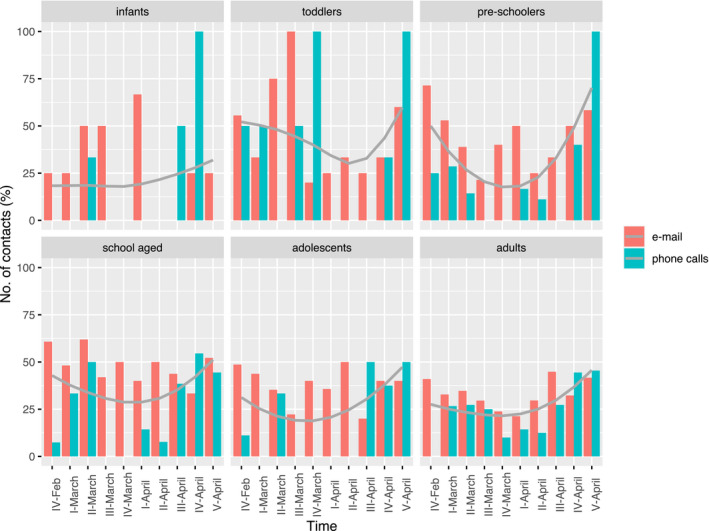
Number of contacts directed to paediatricians during the study period stratified by age groups and the type of contacts. The curved solid grey lines represent nonparametric regressions

Number of contacts directed to paediatricians during the study period stratified by age groups and the type of contacts. The curved solid grey lines represent nonparametric regressions