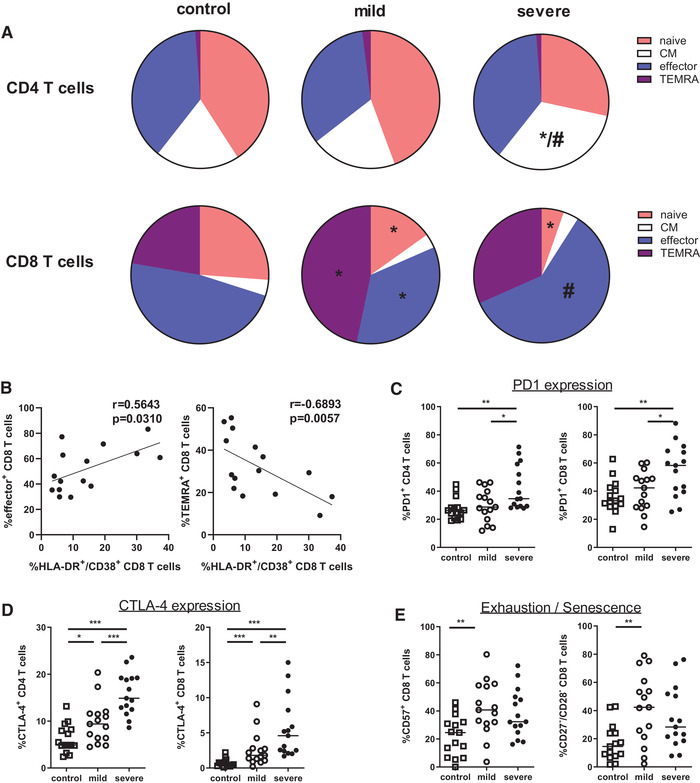
Figure 3.

SARS‐CoV‐2 infection induces enhanced T‐cell differentiation. (A) Naïve (CCR7+/CD45RO–), central memory (CM, CCR7+/CD45RO+), effector (CCR7–/CD45RO+), and TEMRA (CCR7–/CD45RO–) CD4 and CD8 T cells were determined by flow cytometry. Pie charts summarizing the frequencies of naïve, CM, effector, and TEMRA cells within CD4 and CD8 T cells of healthy controls (n = 15) and patients with mild and severe COVID‐19 infection (n = 15, respectively). Data are cumulative of five experiments. Statistical differences were tested using Mann–Whitney U test. Stars (*) represent mild and severe COVID‐19 patients compared to control (p <0.05), hashtag (#) represents mild versus severe disease (p < 0.05), respectively. (B) Correlation of percentages of HLA‐DR+/CD38+ cells and effector cells (left) or TEMRA cells (right) among all CD8 T cells from COVID‐19 patients with severe disease (n = 15) is shown. Spearman`s rank test was used for correlation analysis. (C, D) Graph shows percentage of PD1+ and CTLA‐4+ cells within CD4 T cells (C) and CD8 T cells (D) in healthy controls (n = 15, open square) and patients with mild (n = 15, open circle) and severe (n = 15, black circle) COVID‐19 disease. (E) CD8 T cells of healthy controls and patients with mild and severe COVID‐19 disease were analyzed for expression of CD57, CD27, and CD28. Cumulative data from five experiments of all healthy controls and COVID‐19 patients are graphed, each symbol represents an individual subject and measured by flow cytometry. Bars represent median, *<0.05, **<0.01, and ***<0.001 (Mann–Whitney U test).
