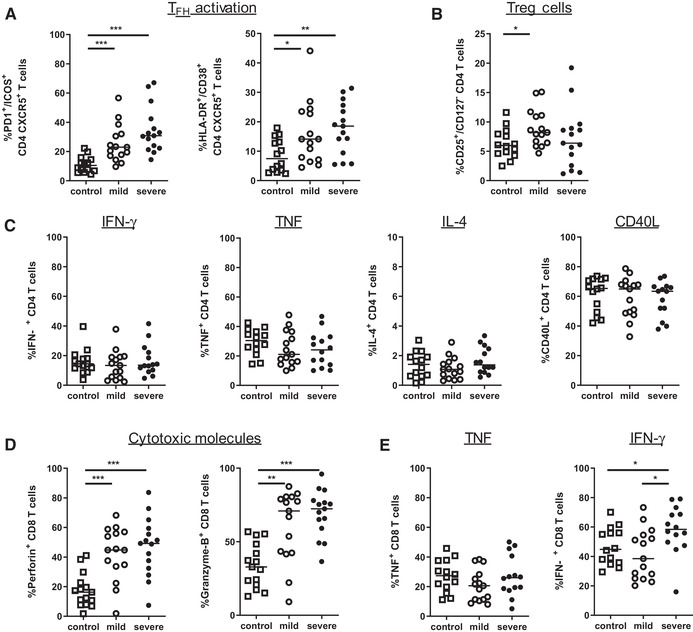
Figure 4.

COVID‐19 influence T‐cell functionality. (A) Frequencies of circulating TFH cells and activated (HLA‐DR+/CD38+) circulating TFH cells were determined in healthy controls (n = 14), and patients with mild and severe COVID‐19 disease (n = 15, respectively). (B) Graph represents percentage of Treg cells among CD4 T cells in all three cohorts. (C) PBMC were stimulated with PMA/ionomycin in the presence of Golgi Stop. Expression of indicated cytokines and CD40L was determined in CD4 T cells by intracellular flow cytometry staining (each group n = 14). (D) CD8 T cells were analyzed for expression of the cytotoxic molecules Perforin and Granzyme‐B (each group n = 15). (E) Expression of IFN‐γ and TNF in CD8 T cells after stimulation with PMA/ionomycin in the presence of Golgi Stop (each group n = 14). Cumulative data from five experiments and each dot represents an individual healthy donor (control, open square), or COVID‐19 patient with mild (open circle) of severe disease (black circle). Data were measured by flow cytometry. Significance within these cohorts is calculated using Mann–Whitney U test with *<0.05, **<0.01, and ***<0.001.
