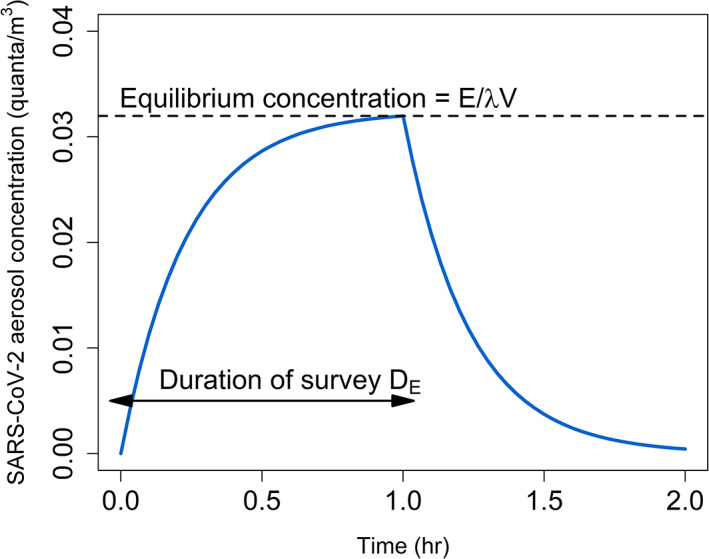
FIGURE 1.

Model of SARS‐CoV‐2 aerosol transmission in an enclosed space over time. The first phase shows the buildup of aerosols during a survey toward an equilibrium level that balances the emission rate against the loss rate. The second phase shows the loss of remaining aerosols through ventilation, decay, and deposition. The graph depicts a scenario in which a single crew member is shedding virus for a 1‐hr survey without wearing a mask in a 500 m3 chamber at 10 C and 90% relative humidity, with a ventilation rate of 1.0 hr−1
