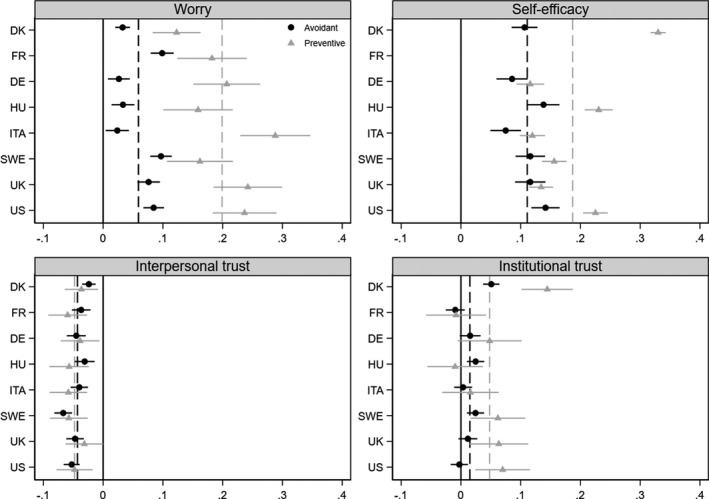
Figure 3.

Country‐specific correlations between protective behaviour and psychological correlates. Note: Filled black circles (grey triangles) show the estimated country‐specific correlations between each of our psychological variables and avoidant behaviour (preventive behaviour). Black (grey) dashed lines refer to the estimated overall associations in Figure 2. Error bars are 95 % confidence intervals that show whether the country‐specific correlations are statistically significantly different from overall associations
