
Figure 1.
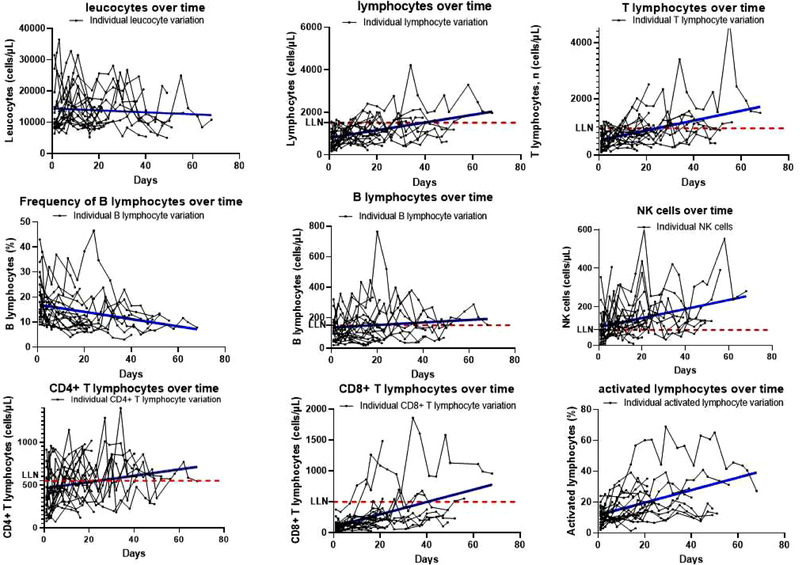
Lymphocyte variations over time in the ICU COVID+ Cohort. Spaghetti plots represent individual variations over time. Single points represent individual counts/frequencies of cells over time. All linear regressions show p < 0.05 for slopes different than zero, except for leucocytes and B lymphocytes for which the variation over time was not statistically significant. LLN, lower limit of normal. Samples were collected twice weekly until hospital discharge due to improvement or death. For every sample, one single experiment was performed since measurements were integrated into our routine diagnostic procedures. Each point in the plot corresponds to the measurements performed from one sample (N = 24 patients).