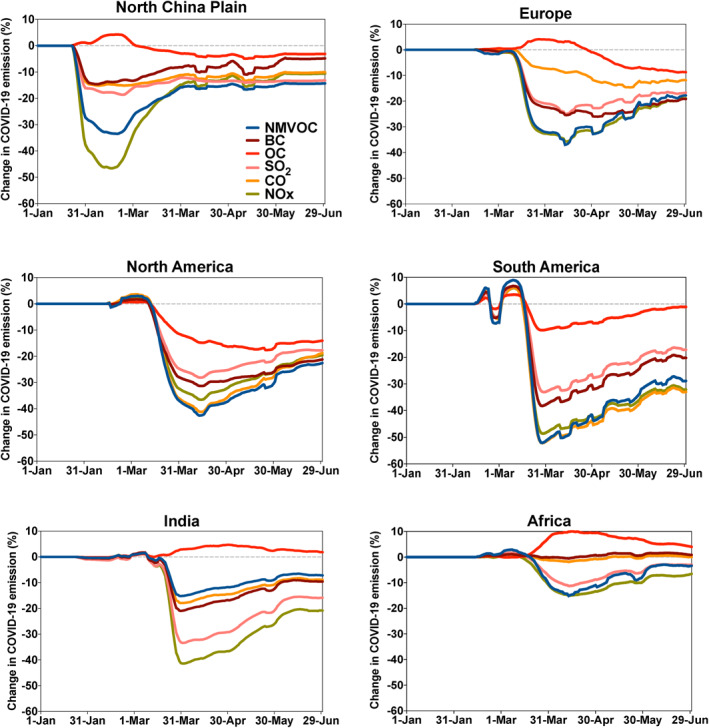
Figure 1.

Evolution from January 1 to June 30, 2020 of the daily geographically averaged adjustment factors (percent) for the emissions for nitrogen oxides (NOx), carbon monoxide (CO), sulfur dioxide (SO2), organic carbon (OC), black carbon (BC), and nonmethane volatile organic carbon (NMVOC) in the North China Plain, Europe, North America, South America, India, and Africa. A weak filter has been applied to smooth out he high frequency variability in the curves. Based on Doumbia et al. (2021).
