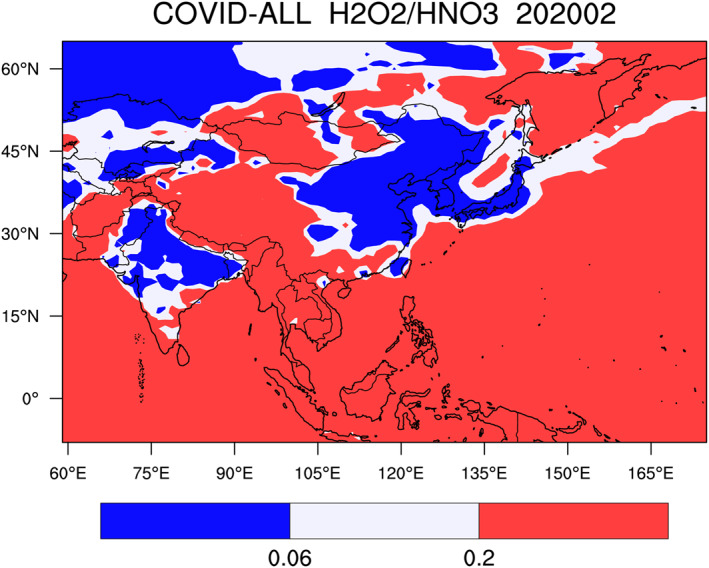
Figure 5.

Ratio between the monthly mean production rate of hydrogen peroxide and nitric acid, a measure of the chemical conditions governing the formation of ozone. Geographical areas in which ozone is NOx controlled (red) and NOx‐saturated or VOC controlled (blue). The white area represents an intermediate situation.
