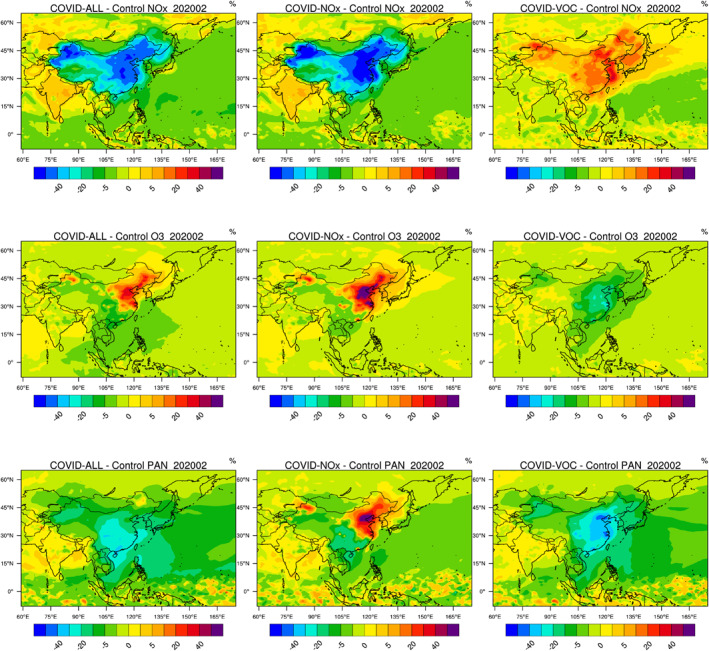
Figure 6.

Percentage change in several chemical variables in China in response to reduced emissions of primary pollutants in February 2020 during the COVID‐19 pandemic. Panels from the top to the bottom: NOx, ozone, and PAN. Left column: reduction in all emission; center panel: reduction in NOx emissions only; right panel: reduction in VOC and CO emissions only. Results for other chemical species are provided in the supplementary information (Figure S9).
