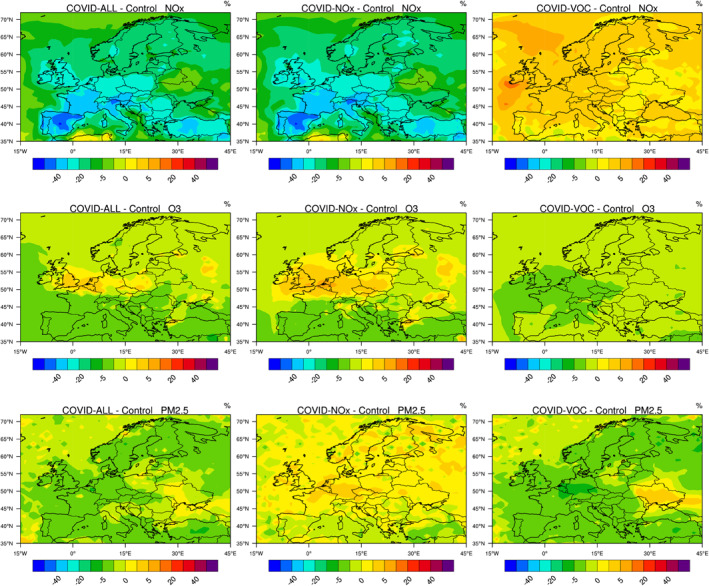
Figure 8.

From top to bottom: percentage change in the surface NOx, ozone and PM2.5 concentrations across Europe in response to the emissions of primary pollutants adjusted for the COVID‐19 pandemic period of March 15–April 14, 2020. Left column: reduction in all emissions; center panel: reduction in NOx emissions only; right panel: reduction in VOC and CO emissions only.
