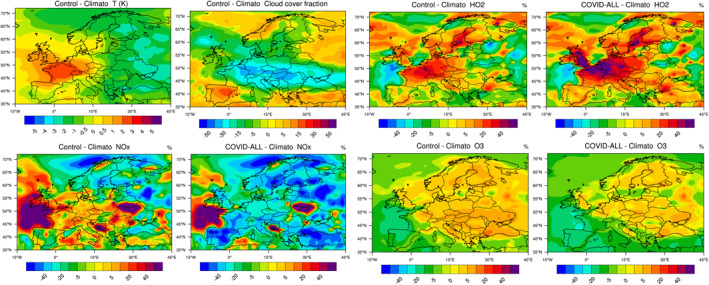
Figure 9.

Change in temperature (K) and in the cloud fraction in Europe across Europe during the period March 15–April 14, 2020 relative to the value averaged over 5 years (2015–2019). Percentage change in the surface concentration of NOx, HO2, and ozone for the same conditions (Control − Climato). Response taking into account the adjustment of the emissions associated with the pandemic and the meteorological anomaly (COVID‐All − Climato).
