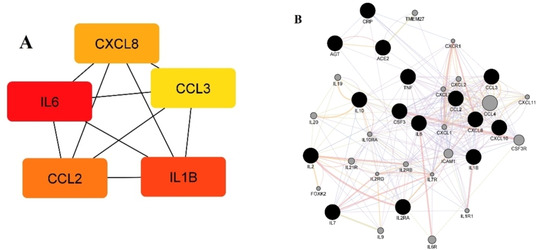
Figure 5.

(A) Five hub genes obtained for genes connected with drugs that might be used in COVID‐19 treatment. Colour of the nodes represents the intensity of correlation with yellow being the lowest and red the highest (Cytohubba Cytoscape plug‐in+MCC method), (B) Tight network of genes connected with candidate drugs for COVID‐19 treatment, together with 20 related genes (GeneMANIA Cytoscape plug‐in). Colour legend: co‐expression – purple; co‐localization – blue; physical interaction‐red; pathway – light blue; predicted – orange.
