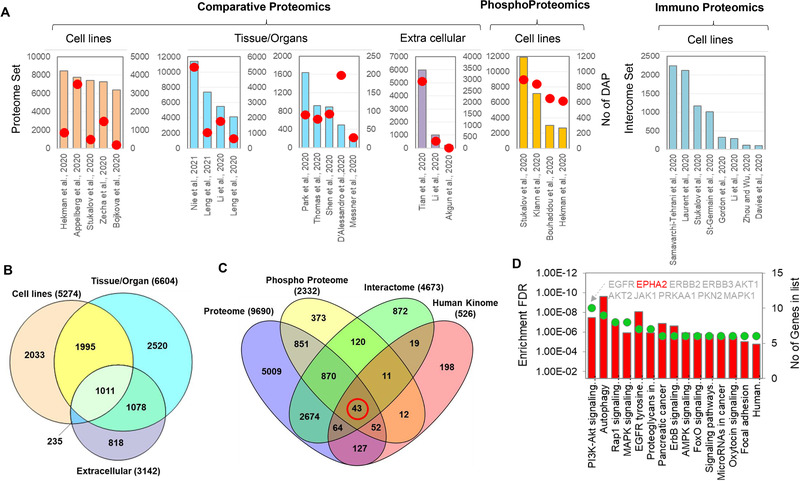
FIGURE 1.

Proteomic platforms utilized for the analysis of SARS‐CoV‐2 and COVID‐19 samples. Datasets collected from 29 published papers were used in this comparative analysis (see details in Table S2). A, bar diagram of the total proteome, phosphoproteome and/or interactome datasets; number of differentially abundant proteins (DAP) identified in each study are indicated by red circles. B, Venn diagram analysis of unique and overlapped number of DAPs reported in five cell lines, nine tissue‐specific and three extracellular proteomic datasets showed in panel A. C, the common (red circle) and unique protein kinases identified in proteome, phosphoproteome and interactome datasets. D, the KEGG pathway analysis of the 43 kinases shared across the three different proteomic platforms
