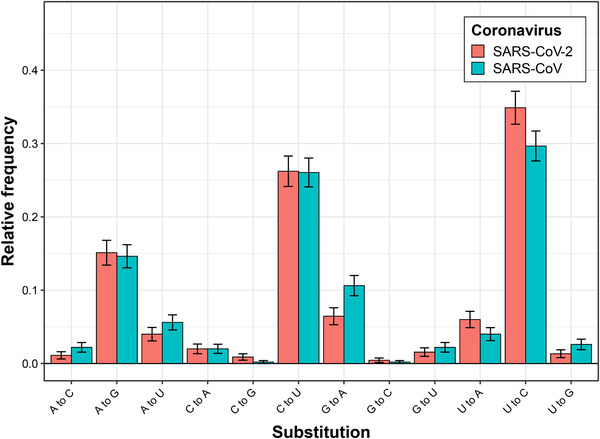
FIGURE 1.

Relative frequencies of different single nucleotide substitutions, which distinguish SARS‐CoV‐2 (red) and SARS‐CoV (blue) from their bat relatives (RaTG13 and Rs4231, respectively).[ 7 ] Differences across substitution frequencies are not significant, as assessed with Pearson's chi‐squared test (p = 0.12)
