
FIGURE 1.
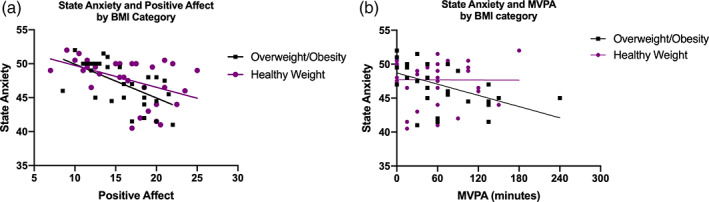
Scatterplots of, A, State Anxiety and Positive Affect stratified by BMI category, B, State Anxiety and Moderate‐to‐Vigorous Physical Activity stratified by BMI category. A, In children with overweight/obesity (Unadjusted Spearman Correlation Coefficient [r s ] = −0.60; P < .001); In children with healthy weight (r s = −0.47; P = .005). B, In children with overweight/obesity (r s = −0.60; P < .001); In children with healthy weight (r s = −0.07; P = .68). MVPA, moderate‐to‐vigorous physical activity average minutes per day