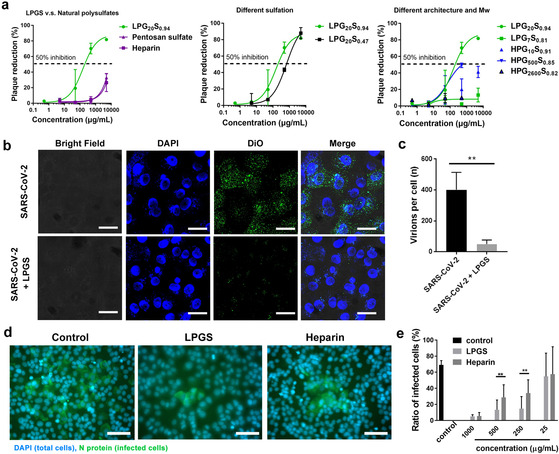
Figure 3.

a) Plaque reduction ratios for the samples at different inhibitor doses. Values are expressed as mean ±SD, n=4. Mw shown here refers to the LPG and HPGS precursors. b) CLSM image for the virus binding to Vero E6 cells in presence of LPGS. Scale bar: 10 μm. c) Analysis of virus binding to Vero E6 cells from CLSM images for the number of virions per cells. More detailed images are shown in Figure S4, Supporting Information. d) Immunofluorescent images revealing the infected cells in the post‐infection inhibition assay. The cell nuclei are stained blue, while the infected cells are stained green by antibodies against the nucleocapsid protein (N) of SARS‐CoV‐2. Scale bar: 50 μm. More images are shown in Figure S6, Supporting Information. e) Ratios of infected cells in each group. “LPGS” in (b)–(e) refers to LPG20S0.94. Values are expressed as mean ±SD, n=4. **p<0.01 from Student t‐test.
