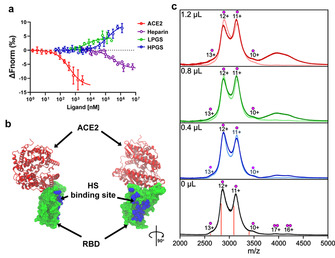
Figure 4.

a) Affinity measurements of RBD of wild‐type SARS‐CoV‐2 with LPGS, HPGS, heparin and ACE2 using MST. Each data point represents mean values with N≥4 experiments, and the error bars show the standard deviation. Data points were fitted according to the mass‐action law function to obtain K d values (see Table 1). The differences in the slopes of the dose‐response curves depend on changes of the hydration shell areas and effective charges, but do not affect the determinations of K d‐values from the inflection points of the curves. b) Crystal structure of RBD bound with ACE2 (PDB ID: 6MOJ). ACE2 is shown in secondary structure representation (red), while RBD is shown in surface representation (green). The amino acid residues of RBD (R346, A348, A352, N354, R355, K356, R357, S359, Y396, K444, N450, R466, I468) found in MD simulations to form contacts with the polysulfates are highlighted in VDW representation (blue), denoting the putative HS‐binding site. More detailed images are shown in Figure S7, Supporting Information. c) Mass spectra of 4.0 μL RBD solution mixed with 0, 0.4, 0.8, and 1.2 μL heparin (light traces) or LPGS (dark trace). The charge states are marked with a single dot for the RBD monomer and with a double dot for the RBD dimer, while the calculated m/z for the 10–13+ charge states of the 34 kDa RBD are marked with orange lines.
