
FIGURE 6.
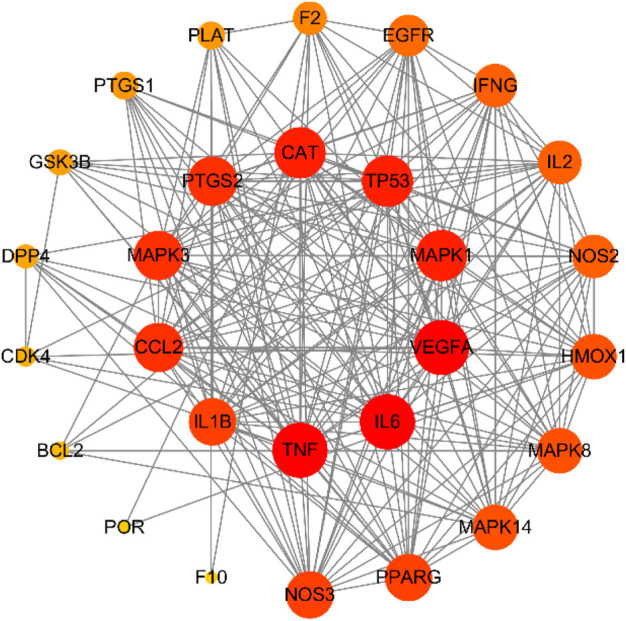
PPI network of 28 potential targets obtained from venn diagram. Nodes in red indicate more interactions with other targets, while nodes in yellow indicate less interactions with other targets.
Official websites use .gov
A
.gov website belongs to an official
government organization in the United States.
Secure .gov websites use HTTPS
A lock (
) or https:// means you've safely
connected to the .gov website. Share sensitive
information only on official, secure websites.
PPI network of 28 potential targets obtained from venn diagram. Nodes in red indicate more interactions with other targets, while nodes in yellow indicate less interactions with other targets.