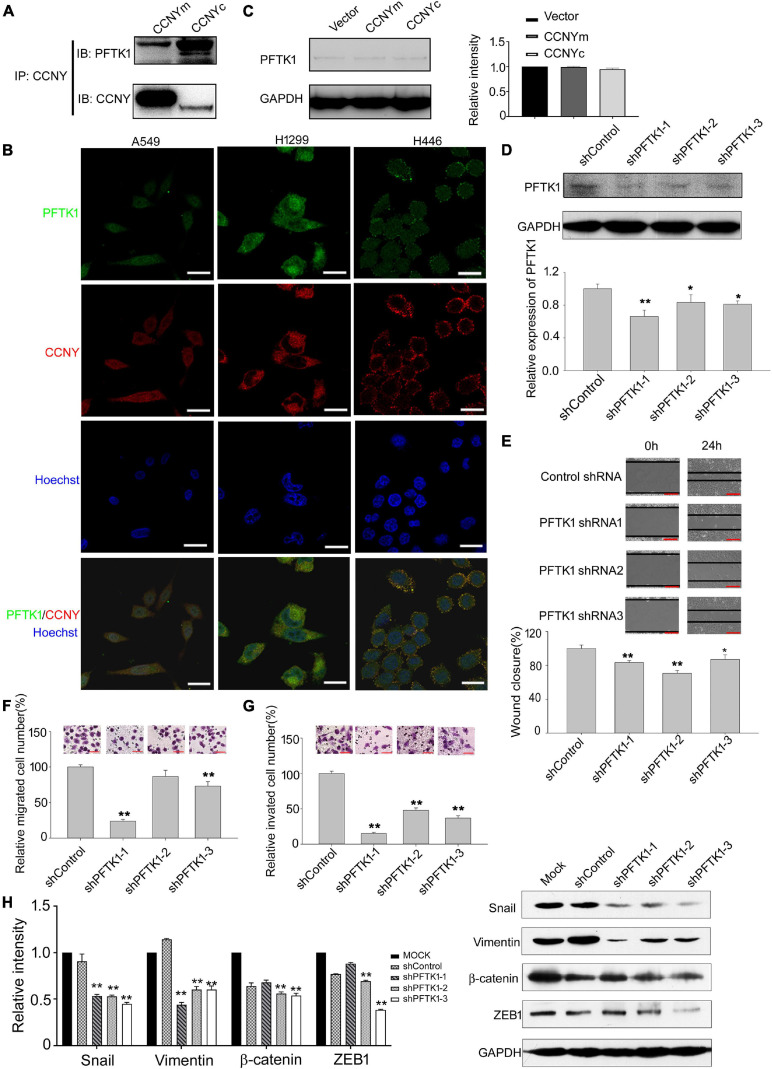
FIGURE 5.
PFTK1 was involved in CCNYc signal pathway. (A) Co-IP assay was done using H1299 CCNYc and H1299 CCNYm cells. Co-IP demonstrated the binding ability of CCNY and PFTK1. (B) Co-localization of PFTK1 and CCNY in human lung cancer cells. PFTK1 and CCNY were marked by immunofluorescence staining (IF). Bars represent 10 μm. (C) The level of PFTK1 in CCNY up-regulated H1299 cells was examined by WB (left panel) and quantified by gray analysis (right panel). (D) H1299 CCNYc cells were infected by recombinant lentivirus carrying shRNA targeting to PFTK1 mRNA. PFTK1 mRNA expression was inhibited by PFTK1-shRNA1-3. The level of PFTK1 was detected by WB (upper panel) and high-content cell analysis (lower panel). *p < 0.05 vs. shControl H1299-CCNYc cells, **p < 0.01 vs. shControl H1299-CCNYc cells (t-test). (E) Wound healing assay performed with PFTK1 downregulation cells. The migration activity is expressed as mean ± SEM. **p < 0.01 vs. H1299-CCNYc cells expressing control shRNA (t-test, N = 3). (F,G) Transwell migration assay and invasion assay of H1299. The data are shown as mean ± SEM. **p < 0.01 vs. H1299-CCNYc cells expressing control shRNA (t-test, N = 3). Bars represent 200 μm. (H) Expression of ZEB1, vimentin, β-catenin and snail and was examined by WB (right panel). The left panel, the level of proteins was quantified by gray analysis. *p < 0.05 vs. H1299-CCNYc cells expressing control shRNA, **p < 0.01 vs H1299-CCNYc cells expressing control shRNA (t-test).

