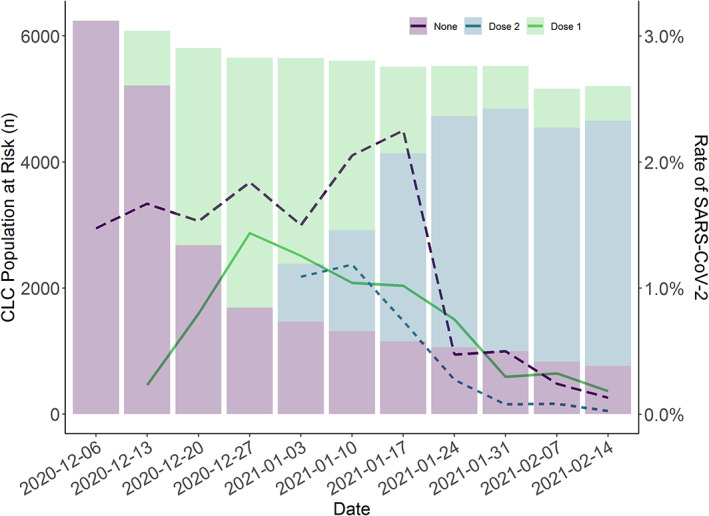
FIGURE 1.

SARS‐CoV‐2 vaccination of Community Living Center (CLC) residents. These results are pooled across 130 CLCs. The line represents the proportion of SARS‐CoV‐2 positive tests (left y‐axis) according to vaccination status. The bars represent the number of residents in the CLCs during the week according to vaccine status (right y‐axis). Vaccines were approved on December 11, 2020 and December 18, 2020 (Week 3 of 2021). The proportion of SARS‐CoV‐2 positive tests declined in the unvaccinated group as well as the vaccinated groups
