FIGURE 1.

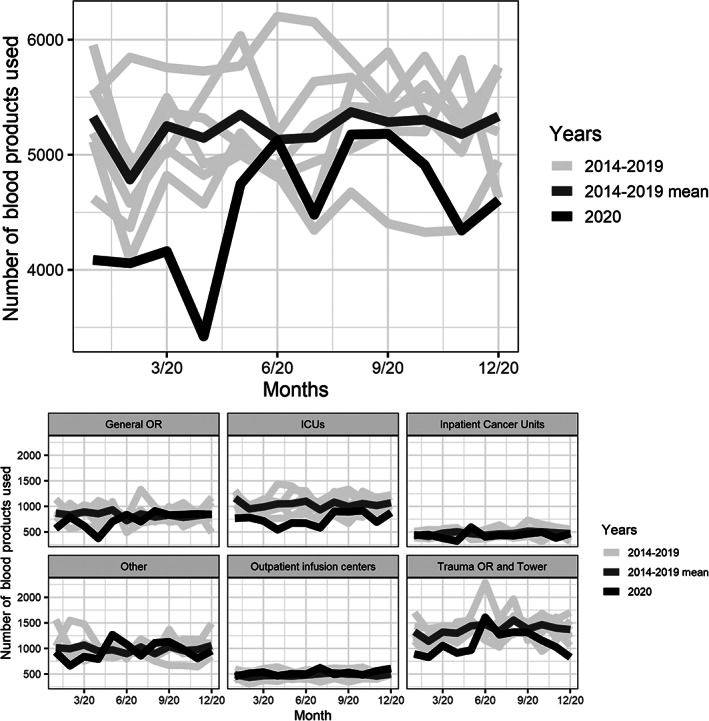
Total blood product usage in 2020 compared to mean usage across 2014–2019 in total and by location. ICUs, intensive care units; OR, operating rooms

Total blood product usage in 2020 compared to mean usage across 2014–2019 in total and by location. ICUs, intensive care units; OR, operating rooms