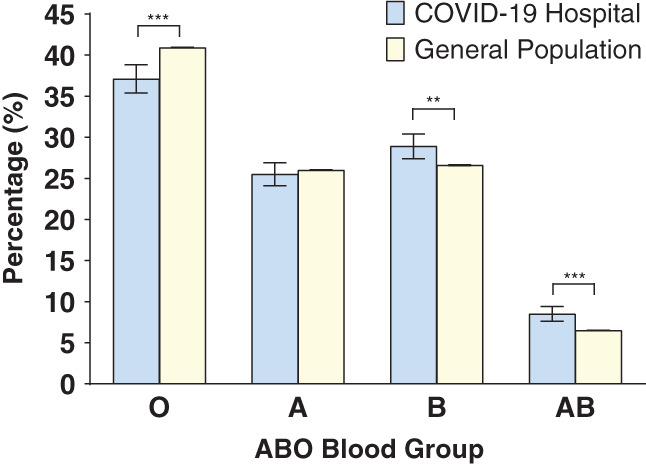
FIGURE 1.

Comparison of ABO blood group distribution between the SARS‐CoV‐2–positive population in the designated COVID‐19 hospital (n = 3305) and Kuwait's general population (n = 3,730,037). The chi‐square test was used to compare the differences between each group. Error bars represent 95% confidence intervals. ***p < .0001 and **p < .005 [Color figure can be viewed at wileyonlinelibrary.com]
