FIGURE 3.

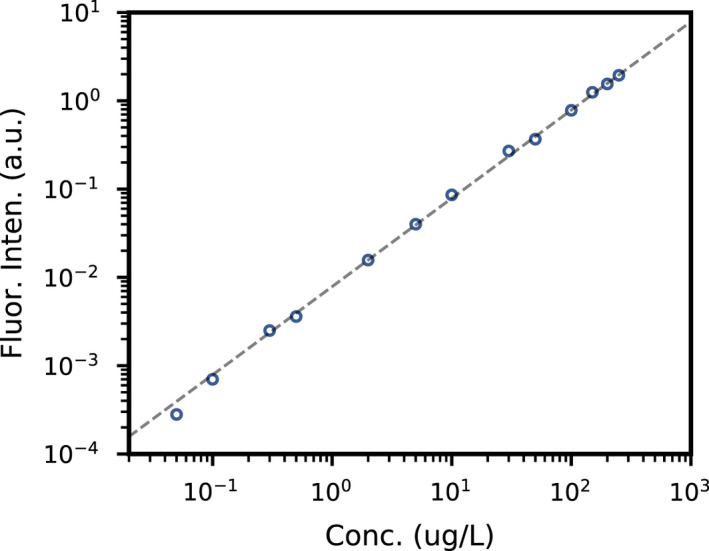
Calibration curve for different concentration standards. Dashed line is the best fit curve with a slope of 1, that is, intensity is linearly proportional to concentration

Calibration curve for different concentration standards. Dashed line is the best fit curve with a slope of 1, that is, intensity is linearly proportional to concentration