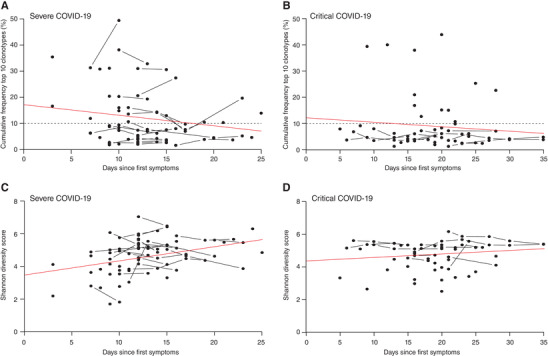
FIGURE 1.

Temporal dynamics of the top 10 clonotypes and Shannon diversity index in severe and critical COVID‐19 patients. No significant differences were observed in the cumulative frequency of the top 10 clonotypes over time between patients with severe (A) and critical (B) disease course. Also, no significant differences were observed in Shannon diversity index of severe (C) and critical (D) COVID‐19 patients. Red lines, derived from linear regression, represent the overall increasing or decreasing trend. The horizontal dashed lines represent the mean cumulative frequency of the top 10 clonotypes in 11 healthy controls, included as a reference. Severe group n = 46, Critical group n = 41.
