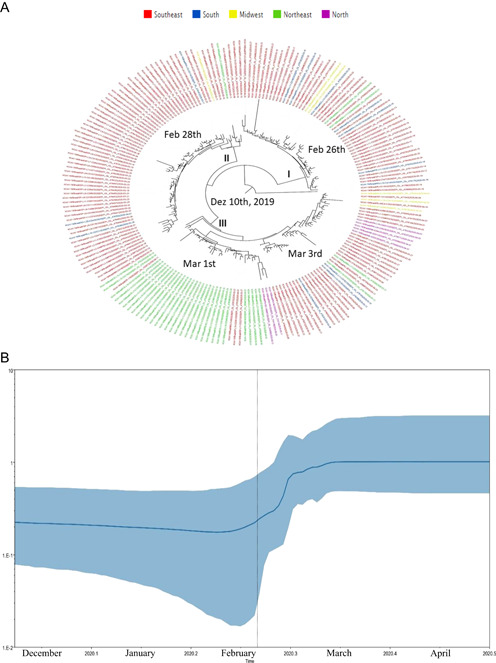
Figure 5.

Maximum clade credibility tree from the evolutionary reconstruction by Bayesian analysis of SARS‐CoV‐2 clade G (Panel A) whole‐genome sequences from Brazilian regions available in GISAID (from March 1 to May 31, 2020). The tMRCA are demonstrated in the nodes with significant posterior probabilities (≥0.95). Panel B showed BSP of SARS‐CoV‐2 whole‐genome sequences obtained from GISAID of clade G. The effective number of infections is reported on the Y‐axis. The timeline is reported on the X‐axis. The colored area corresponds to the 95% credibility intervals of HPD. The vertical line indicate the 95% lower HPD (dotted) of the tree root. BSP, Bayesian skyline plot; HPD, highest probability density; SARS‐CoV‐2, severe acute respiratory syndrome coronavirus‐2; tMRCA, time of the most recent common ancestor
