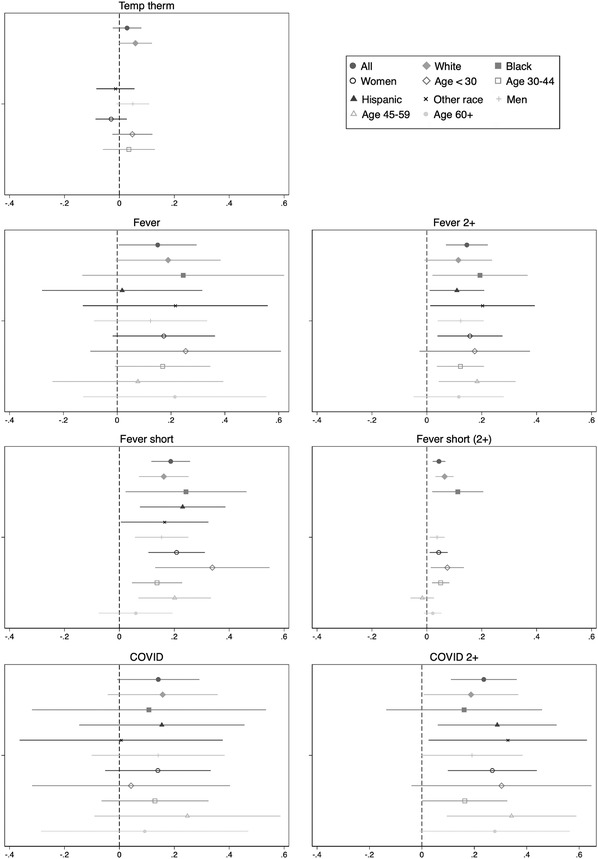
Figure 2.

Effect of Household COVID Diagnosis on Positive Screen Rates by Worker Characteristics.
Source: CIS weeks 1 to 3. Sample is limited to labor market participants from the national sample. A missing point estimate indicates insufficient data to estimate for that subgroup.
Notes: Each figure plots the coefficients of having a COVID diagnosis in one's household on the probability of receiving a positive flag under that subfigure's screen by demographic group. All values are evaluated at sample means.
