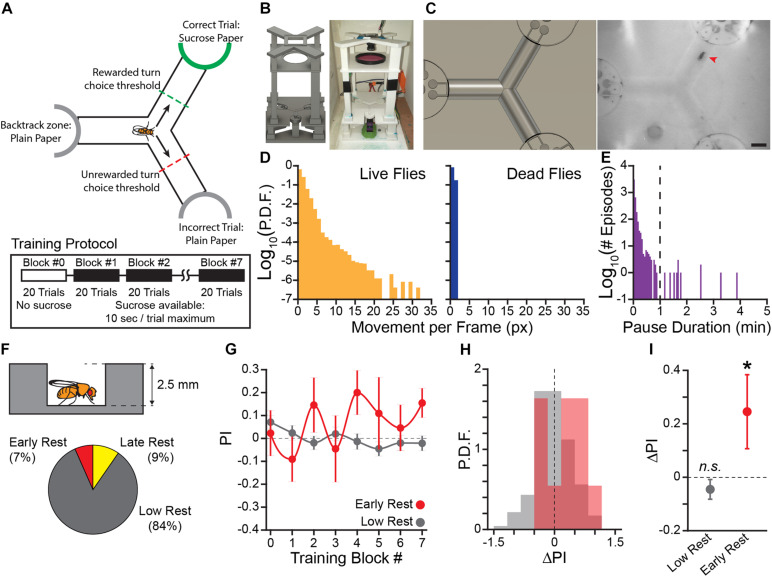
FIGURE 1.
Flies that rest learn the operant contingency in a novel sucrose seeking task. (A) Diagram of operant conditioning paradigm. Sucrose is presented at the end of the track in the reinforced direction. A trial is completed after the fly crosses the choice threshold leaving the center of the track. Each training block is 20 trials, reward presentation begins in training block #1. Sucrose is made available for 10 s following the fly crossing the choice threshold. (B) Rendering of the 3D model of the novel apparatus used for 3D printing (Left) and a photo of a fully assembled apparatus (Right). (C) Field of view of overhead camera in the 3D render (Left) and a video frame of a fly navigating the Y-Track (Right). Red arrowhead indicates the position of the fly. Scale bar: 5 mm. (D) Probability Distribution Function (P.D.F.) histogram of movement (in pixels) per frame (approx. 50 ms) for live flies (Left) and dead flies (Right). One pixel of movement is approximately 90 μm. (E) Histogram of locomotor pause durations from 12 h recordings of locomotor behavior (n = 2 flies, 4127 episodes). Dashed line indicates the 1 min threshold to distinguish short pauses from rest episodes. (F) Schematic of hallway geometry with representative fly for scale (Top), Fraction of flies with each rest phenotype (Bottom). (G) Mean turn direction Preference Index (PI) for each training block. Points plotted in color are flies with early rest (drowsy), points plotted in gray are flies with low rest (restless). (H) Probability Distribution Function (P.D.F.) histograms of change in turn preference index (ΔPI) between training block #1 and #7. Drowsy flies are plotted in red, restless flies are plotted in gray. (I) Mean ΔPI of low rest and early rest flies. Error bars are standard error of the mean, n.s.: groups are not significantly greater than zero, * groups are significantly greater than zero.

