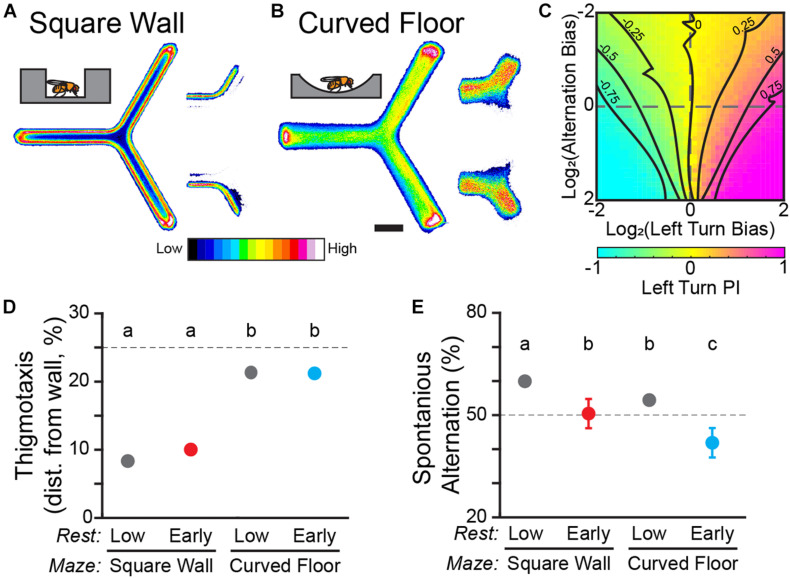
FIGURE 2.
Y-track geometry significantly affects thigmotaxis and spontaneous alternation. (A,B) Position heatmaps of flies in the square wall (A) and curved floor (B) Y-Mazes. Insets (right) show the heatmaps of trajectories through the center of the maze for flies walking from the left zone to the upper zone vs. the lower zone. Scale bar: 5 mm. Color shows relative occupancy of each pixel from low to high. (C) Heatmap of left turn Preference Index (PI) from a population of in silico flies. Each heatmap position is the mean of 1,000 simulated trials of a fly with a range of left-turn bias and alternation bias. Dashed lines indicate zero bias on an axis. Solid lines are smoothed contours of constant PI. (D,E) Mean thigmotaxis (D) and spontaneous alternation (E) for WT flies in square wall and curved wall experiments. (D) Thigmotaxis is defined for each fly as the median distance from the wall of walking locations. The dashed line indicates the median distance from the wall if walking locations were distributed uniformly across the hallway. (E) Spontaneous alternation is measured in the final training block. The dashed line indicates the random rate of alternation. Error bars are standard error of the mean. Groups with the same letter are not significantly different from one another.

