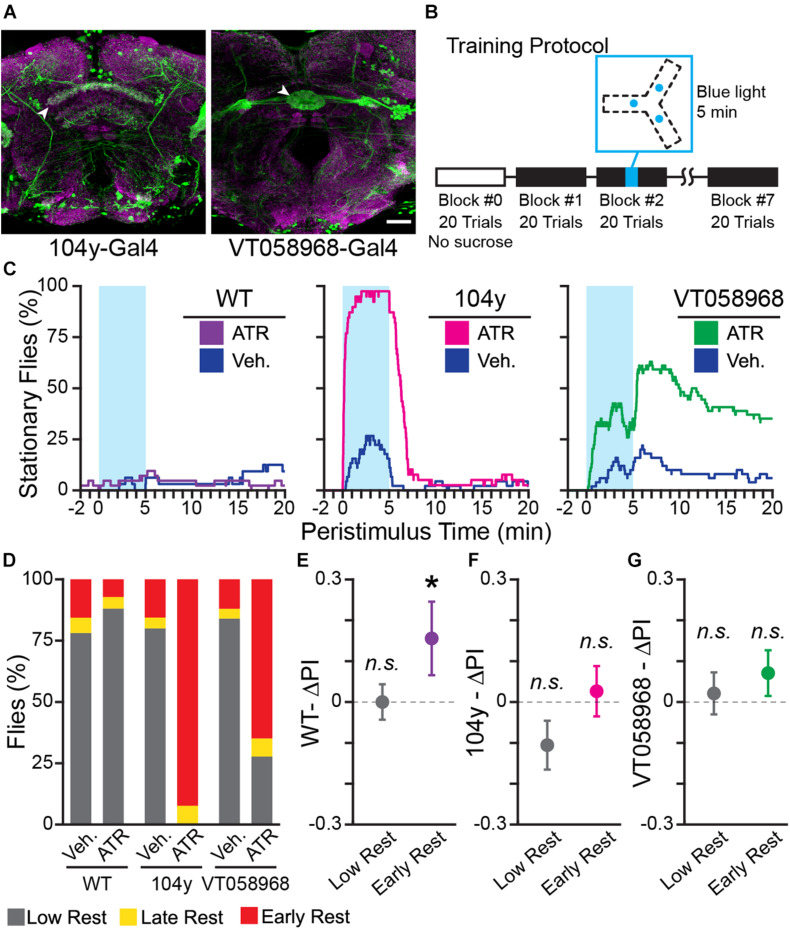
FIGURE 6.
Optogenetically-induced rest is not sufficient to enhance learning. (A) Confocal maximum intensity projections of fly brains expressing 104 y-Gal4;UAS-GFP (left) and VT058968-Gal4;UAS-GFP (right) stained for GFP (green) and Bruchpilot (nc82, magenta). Scale bar is 20 μm. White arrowheads indicate the sleep-promoting neuropil for each Gal4 driver: the dorsal Fan Shaped Body for 104 y-Gal4 and the Ellipsoid Body for VT058968-Gal4. (B) Block diagram of operant conditioning paradigm, with the time of optogenetic stimulus indicated in cyan. The track diagram indicates the locations of each blue LED in the track, these positions are equidistant from the center of the track and illuminate the entire Y-track. (C) Peri-stimulus rest plots for WT (left), 104 y (center), and VT058968 (right). Blue shaded area shows when the blue LED is on. The plots show 20 min of behavior following light onset—this time is not linked to trial times, which vary between animals, and does not encompass the entire duration of the experiment. (D) Percent of each rest phenotype present in each experiment group. (E–G) Results of training WT (E), 104 y (F), and VT058968 (G) flies. Early and low rest flies for each genotype were pooled from the ATR and vehicle groups. Change in PI (ΔPI) is plotted for each genotype; colorful points are flies with early rest (purple: WT, magenta: 104 y, green: VT058968). Error bars are standard error of the mean, n.s.: groups are not significantly greater than zero, * groups are significantly greater than zero.

