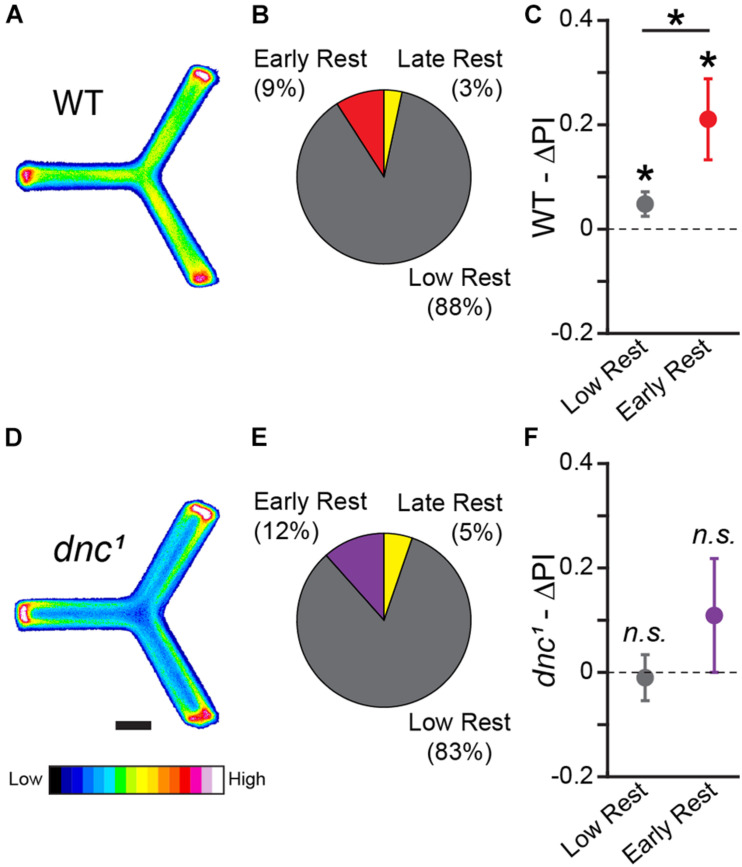
FIGURE 7.
Y-track operant learning is dependent on cAMP regulation. (A,D) Position heatmaps of trained WT (A) and dnc1 (D) flies. Scale bar is 5 mm. Color shows relative occupancy of each pixel from low to high. (B,E) Fraction of WT (B) and dnc1 (E) flies with each rest phenotype. (C,F) Mean ΔPI of low rest (restless) and of early rest (drowsy) WT (C) and dnc1 (F) flies. The mean ΔPI of drowsy and restless WT files are both greater than zero (One-sample bootstrap test; p = 0.005 and p = 0.019, respectively). The mean ΔPI of drowsy WT flies is greater than the mean ΔPI of restless WT files (Two-sample bootstrap test; p = 0.035). Error bars are standard error of the mean, n.s.: groups are not significantly greater than zero, * groups are significantly greater than zero or different from one another.

