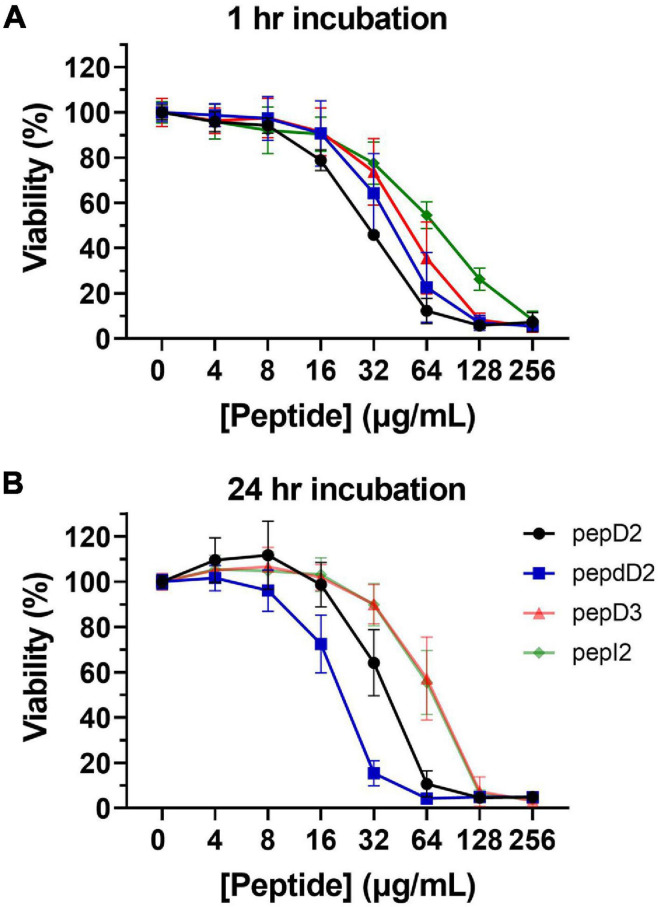
FIGURE 3.
HEK 293 cytotoxicity from pepD2, pepdD2, pepD3, and pepI2. (A) 1-h treatment and (B) 24-h treatment. The pepD3 and pepI2 data in panel (B) are too close to be distinguished. Each concentration was tested independently three times, and each time, three repeats were used. The data are expressed as the mean ± SD.

