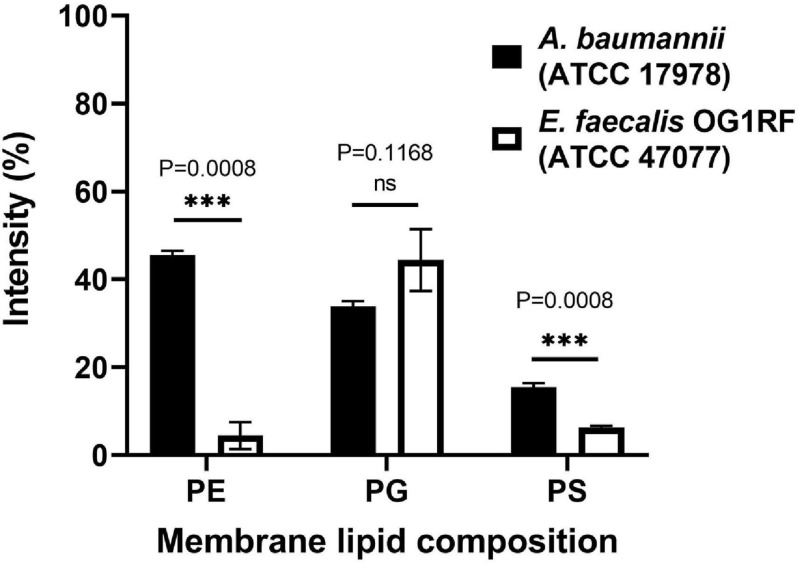
FIGURE 5.
Lipid composition analysis of A. baumannii ATCC 17978 and Enterococcus faecalis OR1RF ATCC 47077. The lipid composition of the TLC images (Supplementary Figure 4) was analyzed by ImageJ software and normalized to the total lipid intensity. Statistical analysis was performed by Welch’s t-test (N = 3). ns, not significant, ∗∗∗P < 0.001.

