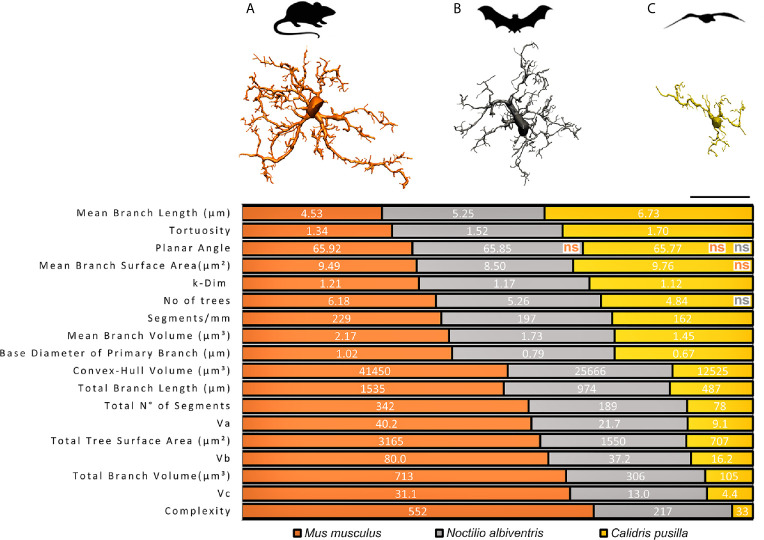
Figure 1.
Graphical representation of the comparative analysis of morphometric features between species. Top, schematic illustration of M. musculus (A), N. albiventris (B) C. pusilla (C) with correspondent three-dimensional reconstructions of microglia performed in the dentate gyrus of mammals and in the hippocampal V region of C. pusilla. 3D representative reconstructions of microglia are closest to the “mean cell” of each species. All morphometric features comparisons between species are significantly different (p < 0.05), except those indicated as non-significant (ns), and reproducing the color of the species being compared with C. pusilla. Three distinct mean values of each morphometric variable, one for each species, are exhibited on each line over three distinct colored areas as follows: orange, gray and yellow shaded areas corresponding to M. musculus, N. albiventris and C. pusilla, respectively. Note that the extent of each color shaded area on each line are the mean percentual values of each species. Scale bar = 25 µm.

