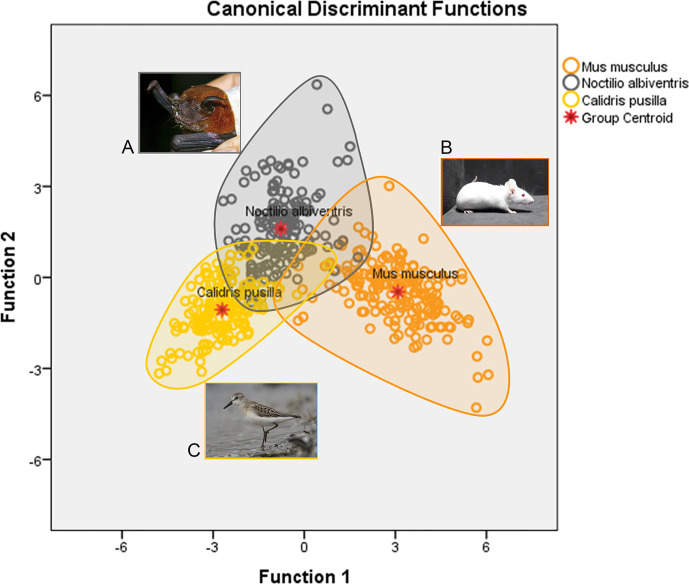
Figure 2.
Graphic representation of the canonical discriminant function analysis of three-dimensional microglia reconstructions in the dentate gyrus of N. albiventris (A), M. musculus (B) and hippocampal V region of C. pusilla (C). Open color circles illustrate the microglia distribution in each species. The ellipsoid for N. albiventris (gray circles) intercepts both M. musculus (orange) and C. pusilla (yellow), with a greater overlap with C. pusilla Function 1, explains 82.0% of the variance (for details of statistical analysis see Supplementary Material SM1 ).

