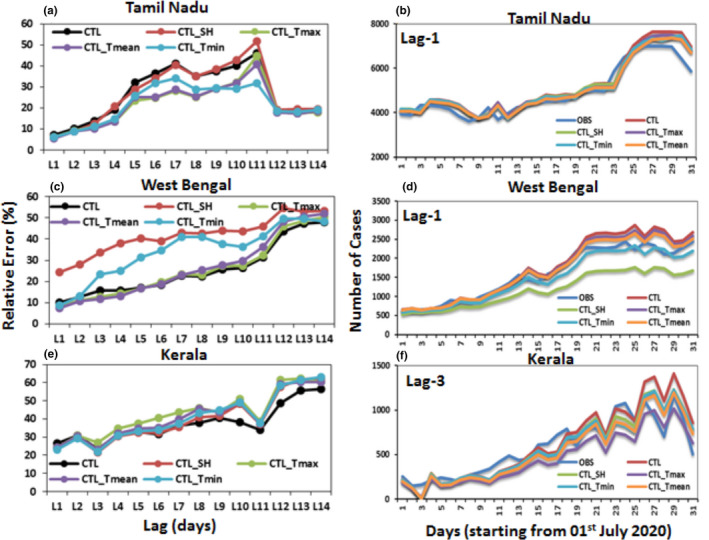
FIGURE 9.

Skill (Average relative error) of univariate (CTL) and multivariate (CTL_SH, CTL_Tmax, CTL_Tmin, CTL_Tmean) LSTM models during the test period (1 July to 31 July 2020) for the states of Tamil Nadu, West Bengal, and Kerala. Where L1 to L14 represents the 1 to 14 days of lag data utilized for forecasting of the next day COVID‐19 cases
