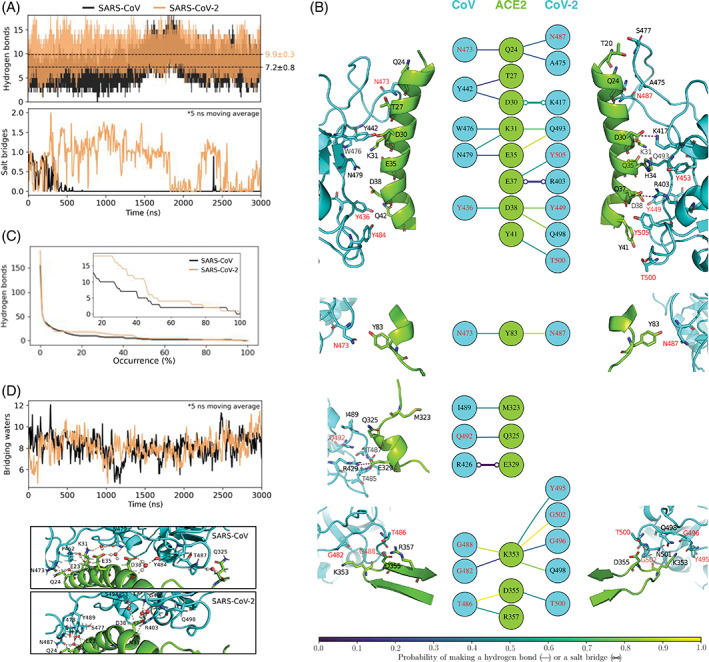
FIGURE 2.

Polar contacts of angiotensin converting enzyme 2 (ACE2) with spike proteins of CoV and CoV‐2. A, Time evolution of hydrogen bonds and salt bridges between ACE2 and spike RBDs. Dashed lines indicate time‐averages, and statistical errors are obtained from block averaging (Figure S4 of Supporting Information). B, Structural map of hydrogen bonds and salt bridges between ACE2 and spike. ACE2 associates with spike at four regions that are non‐contiguous in its primary sequence. These four interfacial regions are shown separately. The colors of the lines connecting the residues in the central panel indicate their occurrence probabilities. Note that for the sake of clarity, only those hydrogen bonds and salt bridges are shown that are observed for at least 15% of the total simulated time. The amino acid of spike labeled in red are the ones that are conserved in the two spike RBDs. C, Numbers of unique hydrogen bonds as functions of their occurrence probabilities. The inset zooms in on the 15% to 100% probability region. D, Time evolution of waters that bridge interactions between ACE2 and spike by hydrogen bonding simultaneously with both proteins. The images below show the bridging waters in the 3 μs snapshots of the MD trajectories
