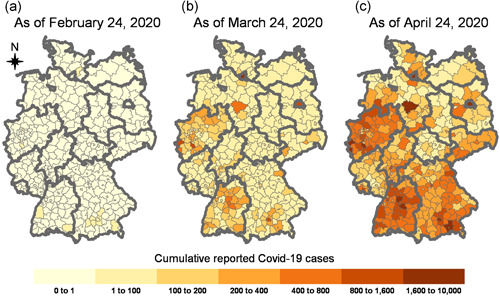
Figure 1.

Cumulative reported COVID‐19 cases at the beginning and the end of our period of analysis at the NUTS‐3 level. The data comes from RKI (2020a). Our unit of analysis are 401 NUTS‐3 regions. Bold gray lines indicate the borders of the 16 federal states [Color figure can be viewed at wileyonlinelibrary.com]
