
Figure 5.
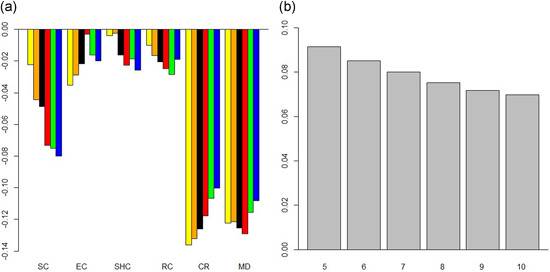
Comparison of response and spillover coefficients for varying lags. (a) Response coefficients for lags between 5 and 10 days and (b) Spatial spillover coefficient for lags between 5 and 10 days. Horizontal axis: Public health measures, vertical axis: Response coefficients of spatial panel data models, Yellow bars: Lag 5, Orange bars: Lag 6, Black bars: Lag 7, Red bars: Lag 8, Green bars. Lag 9, Blue bars: Lag 10. CR, contact restrictions; EC, establishment closure; MD, face mask duty; RC, restaurant closure; SC, school and daycare facilities closure; SHC, shopping mall closure [Color figure can be viewed at wileyonlinelibrary.com]