
Figure 3.
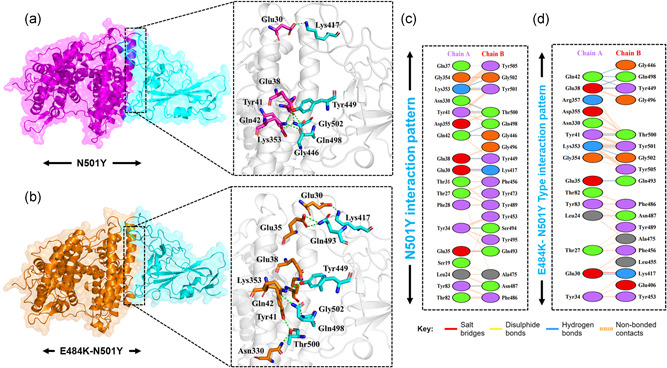
Docking representation of the N501Y and E484K‐ N501Y mutant complexes. (a) represent the binding interface of the N501Y complex along with its stick representation of the key hydrogen interactions. (b) shows the binding interface and stick representation of the key hydrogen bonding interactions of the E484K‐ N501Y mutant. (c, d) represent the 2D interactions representation including hydrogen, salt bridges and nonbonded interactions in N501Y and E484K‐ N501Y complex