
Figure 7.
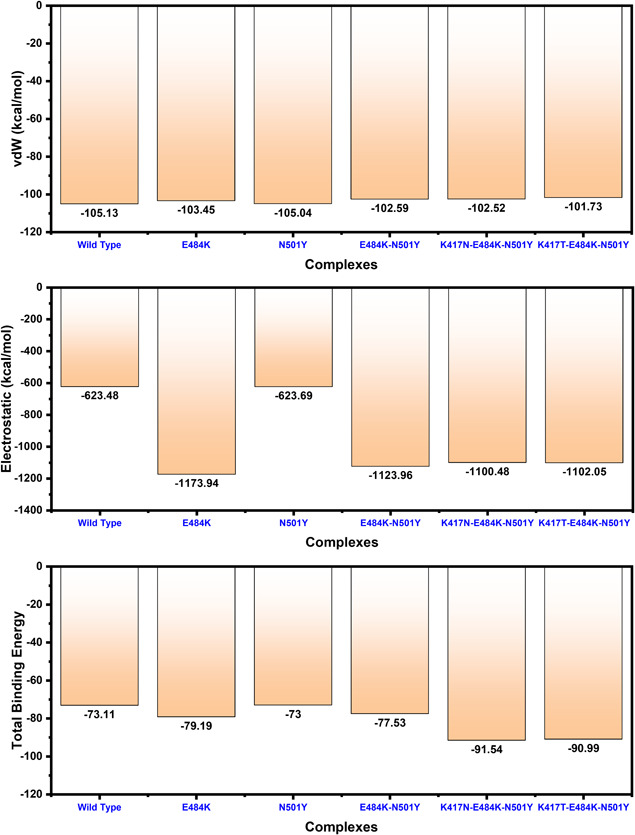
Free energy calculation results obtained from MD simulation trajectory of the wild type and mutant complexes. The top bar graph shows the vdW contribution by each complex, the 2nd bar graph shows the electrostatic energy while the bottom bar graph shows the total binding energy. All the energies given here are calculated in kcal/mol