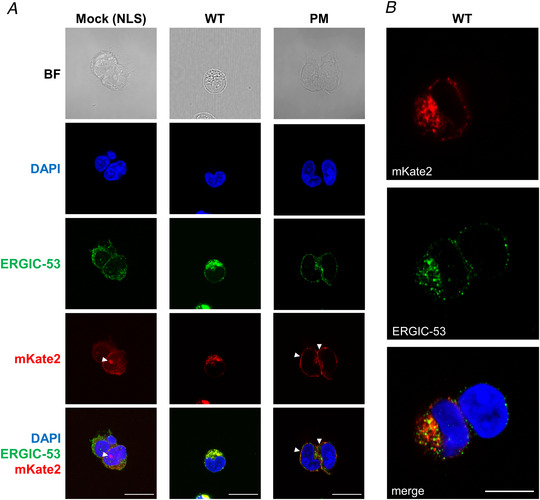
Figure 2. Expression of SARS‐CoV‐2 WT and PM targeting constructs in HEK 293S cells.

A, representative confocal images of HEK 293S cells transfected using three constructs: pcDNA3 vector‐mKate2‐NLS (mock), SARS2‐E‐mKate2 (WT) and SARS2‐E‐Ala6‐ΔPBM‐PM‐mKate2 (PM). We were able to study the subcellular distribution of the E protein in HEK 293S cells by visualizing the red fluorescence signal of mKate2. Immunolabelling with anti‐ERGIC‐53 shows that expression of the WT construct is largely confined to intracellular organelles adjacent to the nucleus, presumably the ER and the ER–Golgi intermediate compartment (anti‐ERGIC‐53). Deletion of the ER retention signal first identified in the SARS‐CoV‐1 E protein combined with the insertion of a consensus Golgi export signal from the mammalian ion channel Kir2.1, allowed us to detect the PM construct in the plasma membrane. Panels show bright field (BF) images, nuclei stained for DAPI, mouse anti‐ERGIC‐53, and the C‐terminal red fluorescent tag, mKate2. These images show nuclear expression of NLS (mock, white arrowheads), organelle expression of E protein (WT) and expression of E protein at the plasma membrane (PM, white arrowheads). The bottom row shows merged images for DAPI, ERGIC‐53 and mKate2. Scale bar, 20 μm. B, a representative image of HEK 293S cells transfected with WT construct, which shows at higher resolution the co‐localization of SARS‐CoV‐2 E protein (mKate2) with the marker for ERGIC‐53 surrounding the nuclei (DAPI staining). Scale bar, 10 μm. [Color figure can be viewed at wileyonlinelibrary.com]
